This is a continuation of my previous optimization guide.
If you haven’t read that one, it’s where we take a RON campaign and optimize it by breaking it down using a strategy we create based on what the data tell us.
To continue, I am now looking at the data from my 1st level optimization campaigns, all feeding into the same RedTrack campaign.
I looked at source IDs, target IDs, campaign IDs. I determined that we received a total of 338 leads, and we got 2 FTD’s – our ROI is around 80% pure profit.
We are doing a budget of $100 per day. We want to look at our data again and see what jumps out and improve our numbers.
ZONE IDs, and TARGET IDs, didn’t produce any statistically significant information. For us (in this case, there weren’t 10 FTD’s from one campaign for us to know thats a winner for sure.)
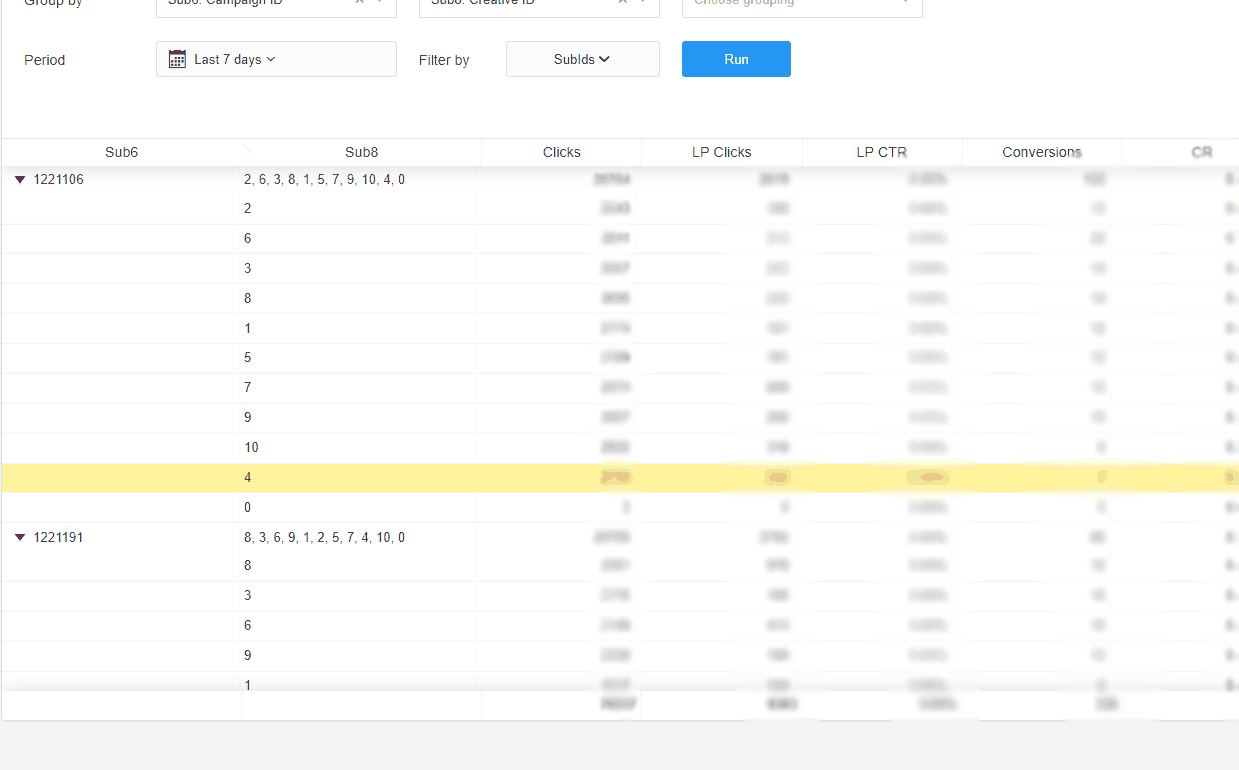
So we have to look at the variables where we can ‘clean’ our campaigns. And this is CREATIVE ID
We do that by breaking our campaigns, down by creative ID.
We want to take the top 5 creatives for our 4 campaigns. We want to take the top by CR % so we extend everything, by clicking down arrow:
Then, we click the CR to sort it in descending, and we take the top 5 creatives and pause the rest.
Afterwards, we increase the budget from $100 to $200 per day and we let it run for 2-3 days and we check our data again.
PS: Did you claim your 5% deposit bonus on ZeroPark? It works for both new and existing customers.


